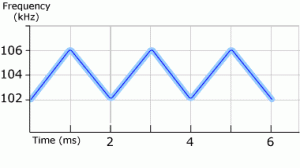
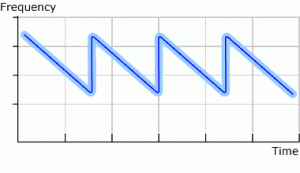
There are many ways to alter the characteristics of ultrasonic waves in a liquid contained in a tank. The ultrasonic waves can be frequency modulated (FM) by varying the output frequency of the ultrasonic generator. The ultrasonic waves can be amplitude modulated (AM) by changing the amplitude of the generator output and/or by tailoring the impedance versus frequency characteristics of the transducer array. A frequency modulated ultrasonic wave can be amplitude modulated. This is the most general case of "designer waveform" for a single generator driving a single transducer array. Multiple generators of different frequencies can drive multiple transducer arrays on the same tank; the addition of the resulting sound waves within the liquid creates the "designer waveform". This article will attempt to catalog the most useful, newest and theoretically interesting of the many ultrasonic waveforms that can be produced in an ultrasonic tank. Where appropriate it will give the history of the waveform, a practical description of its function and suggestions of where it may be advantageous, or in some cases, destructive. Empirical data supporting the theory is left for a future article. Before starting the body of this article, we would like to give credit to inventors such as Antonevich, Branson, Cook, Puskas, Honda, Kosaka, Kouzaka, Ferrell, Thompson, Miyamoto, Goodson, Shibano, Saito, Quint and Pedziwiatr who have patents issued or pending that describe some of the concepts presented below. Sweeping frequency, the most primitive type of FM, has had a major impact on the ultrasonic cleaning industry since 1988. When done correctly, it improves the performance of an ultrasonic cleaner and generally reduces the damage to delicate parts caused by single frequency ultrasonics. Figure 1 shows a graph of frequency versus time for a typical sweeping frequency 104 kHz ultrasonic generator with a four kilohertz bandwidth and a 500 Hz sweep rate.
Figure 1 Sweeping Frequency
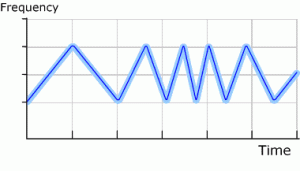
Figure 2
Sweeping the Sweep Rate
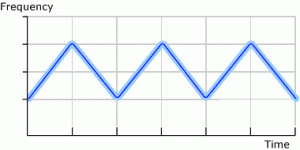
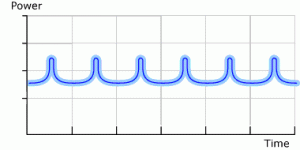
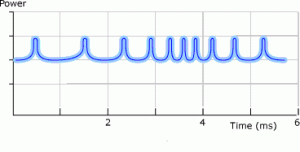
One FM improvement to the conventional fixed frequency sweep rate is a non-constant sweep rate. This can be accomplished by making the sweep rate random or by changing the sweep rate as a function of time. This designer waveform is often referred to as sweeping the sweep rate. An example of a non-constant sweep rate is shown in figure 2. The main reason for a non-constant sweep rate is to eliminate any single frequency sweep rate from the system because a part being cleaned can be excited into resonance by two times the frequency of the single frequency sweep rate. Many delicate parts will fracture when excited into resonance. The mechanism for producing the energy input responsible for exciting the part into resonance will be more thoroughly explained in this article when the topic of transducer impedance curves is covered; however, here is a brief description. When a typical Langevin type transducer is swept through a bandwidth of frequencies, the output power is not constant for each frequency. Generally, the output power of the generator peaks near the center of the bandwidth. When sweeping up in frequency, a peak pulse of power is put into the tank at the center of the sweep range. When sweeping down in frequency, another peak pulse of power is put into the tank at the center of this sweep range. This process continues producing equally spaced power pulses at a rate equal to two times the sweep rate. See figures 3 and 4 that show a conventional sweep rate graph and a graph of power into the liquid, each on the same time scale.
Figure 3
Single Frequency Sweep Rate
Figure 4
Power Peaks at 2X the Sweep Rate
If a delicate part has a resonant frequency at or near two times the sweep rate, the large amplitudes that the part goes through when it is resonated by the repetitive peak power pulses are likely to cause damage to the part. With an understanding that resonance phenomena are caused by repeatedly pumping energy into a part at a resonant frequency of the part, it should now be obvious that a non-constant sweep rate will vary the spacing between the power pulses. Therefore, there is no fixed frequency at which the power pulses are supplied to the liquid and therefore, no repetitive single frequency to excite the part being cleaned into resonance. See figure 4A for a graph of power versus time when the generator sweeps the sweep rate.
Figure 4a
Peak power spacing as a result of sweeping the sweep rate.
Part resonance is prevented.
Another designer waveform variation on conventional sweeping frequency is to monotonically sweep the frequency from high frequency to low frequency. This causes an ever-expanding wavelength in the tank. The ever-expanding ultrasonic wave puts an extra upward force on contamination in the liquid. For bottom-mounted transducers on a tank with overflow weirs, this extra upward force helps the system purge itself of the contamination. Figure 5 shows a frequency versus time graph of a monotonically sweeping system.
Figure 5
Monotonically sweeping from high frequency to low frequency.
A practical ultrasonic generator for precision cleaning would combine the concepts in figure 2 and figure 5 (i.e., a monotonic sweep direction from high frequency to low frequency with the sweep rate constantly changing). This gives the advantages of sweeping frequency, quickly purging contamination from the tank and protecting the part from damaging resonance. Although the situation is more difficult to visualize, it is worthwhile to consider the frequency of the amplitude modulation of an ultrasonic system (conventionally a single frequency, e.g., 120 Hz) and apply the non-constant frequency ideas and monotonic sweeping direction to this AM pattern. If, for example, the AM is a series of pulses and the spacing between these pulses is non-constant and always getting larger, you might expect results similar to those described for non-constant monotonically sweeping FM. Of course, the AM spacing cannot get larger forever. Typically, a degas time is inserted at the lowest AM frequency and the process starts over at the end of the degas time with the highest AM frequency. Next, consider putting multiple frequencies into the ultrasonic tank. There is a 40-year history of multiple frequency cleaning and processing systems. These systems can be organized into several classes of equipment. The first class of equipment consists of a tank holding liquid with two or more transducer arrays that couple sound energy into the tank. Each of these arrays is driven by a different frequency generator. Typically all the generators are operated at the same time or there is an overlap in the operating times of the generators so that two or more frequencies are simultaneously put into the tank for at least part of the cleaning cycle. The history of this first class of equipment starts in 1959 when Norman Branson constructed three transducer arrays on a tank driven by three generators where the operation periods of these generators overlapped. In 1974 a tank was designed and built at Branson Cleaning Equipment Company that had an array of 25 kHz transducers on the bottom and a second array of 40 kHz transducers on one side; each of these arrays was simultaneously driven by the appropriate frequency generator. Similar systems were designed and built by others in the 1970's, e.g., Blackstone, but no useful application was found for the technology. In the mid 1990's Amerimade Technology sold systems consisting of tanks with angled walls and two arrays of transducers on different walls. Each array was driven by a different frequency generator: one sweeping around 72 kHz and the other sweeping around 104 kHz. At about the same time, Zenith sold a two-frequency system where the different frequency sound waves intersected at 90 degrees. Unlike the earlier 25 kHz and 40 kHz systems that found no useful application, the personal computer industry now existed and these Amerimade and Zenith systems were sold in large volume to the hard disk drive industry. In a 1997 patent, Honda describes high and low frequency transducers on a tank, where the high frequency transducers are driven normally and the low frequency transducers are driven for short periods of time to intermittently destroy the high frequency bubbles. In a 1999 patent, Pedziwatr shows two arrays of transducers interspersed on a tank and driven by two different frequency generators. In another 1999 patent, Ferrell describes two arrays of transducers on different angled walls of a plastic container and driven by different frequency generators. A second class of multiple frequency cleaning equipment has one array of multiple frequency transducers that couple sound into the liquid in the tank. This array is driven by a pulse or square wave generator or some other form of shock excitation where the generator output is rich in harmonic frequencies. Multiple resonances in the multiple frequency transducer array are excited by the appropriate harmonics in the generator's output. Therefore, multiple frequencies are simultaneously coupled into the tank from a single transducer array and a single generator. Most of the history for this class of equipment is found in the patent literature; we are not aware of commercial systems employing these concepts prospering in the marketplace. In U.S. Pat. No. 3,315,102, Quint describes driving a tank with simultaneous multiple frequencies through shock excitation from a spark gap generator. In U.S. Pat. No. 3,371,233, Cook teaches shock excitation of a non-symmetrical transducer to simultaneously produce many frequencies in a tank. U.K. Pat. No. 1,331,100 shows a non-symmetrical transducer that can simultaneously vibrate at a number of different frequencies and harmonics of these frequencies. When driven by a generator with a harmonic-rich output, this transducer produces simultaneous multiple frequencies. Other transducers capable of multiple frequencies are disclosed by Thompson, Goodson and Puskas in U.S. Pat. Nos. 4,633,119, 5,748,566 and 6,002,195 respectively. In U.S. Pat. No. 5,076,854, Honda teaches that rapidly switching to different frequencies shocks the transducer into producing multi-frequencies in between the drive frequencies. In U.S. Pat. No. 5,462,604, Shibano gives a variation on this theme by saying he produces square wave drive characteristics in the liquid by driving the transducer with odd integer multiples of the natural resonant frequency of the transducer (i.e., the Fourier components of the square wave). The third class of multiple frequency equipment is a new class of liquid cleaning and processing equipment where there is one transducer array and one generator that produces continuously changing frequencies in a bandwidth of the transducer array for a period of time and then discontinuously jumps to a different bandwidth where changing frequencies are continuously produced for another period of time before another discontinuous jump to a third bandwidth and so on. Although more time is needed before a clear case can be made for which class of multiple frequency equipment will win in the commercial world, initial indications are that it is the third class of equipment. There are many performance advantages inherent in this third class of multiple frequency equipment. A typical part being cleaned has many types and sizes of contamination; each different frequency works best on a different subset of this contamination. Therefore, improved cleanliness is obtained when a full range of different frequencies is used to clean the parts. The order in which the different frequencies are presented to the parts has been shown to have a unique cleaning effect. This implies the best cleaning results when many different permutations of the cleaning frequencies are presented to the parts. The useful effects of lower frequencies can be employed without the damage from cavitation by limiting the time they are input into the system to fractions of a second. Various chemistries, processes and parts can be accommodated in the same tank because of the wide range of programmed frequencies available in a multiple frequency system of the class III type. Although the parameters that effect the energy in each cavitation implosion and the cavitation density are only loosely related to designer waveforms, a quick review of these topics is appropriate.
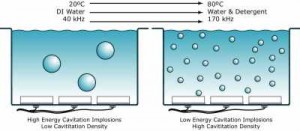
Figure 6
Controlling the energy in each cavitation implosion is important to prevent pitting or craters in the part being cleaned. The energy in each cavitation implosion is reduced if the temperature of the liquid is increased, if the surface tension of the liquid is decreased and if the frequency of the ultrasound is increased. Figure 6 gives a pictorial description of these change effects. Changing the ultrasonic frequency is the most commonly used technique to control the energy in each cavitation implosion. Cavitation density is the number of cavitation implosions per unit volume per unit of time. If the input energy to the tank is kept constant, the cavitation density increases as the energy in each cavitation implosion decreases. Therefore, higher ultrasonic frequencies are typically associated with higher cavitation density. This high cavitation density is a significant factor in the higher percent particle removal rates at higher ultrasonic frequencies. Figure 6 also gives a pictorial description of cavitation density.
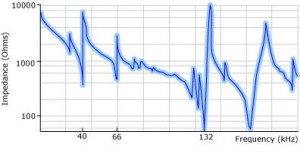
Figure 7
Impedance plot for a narrow bandwidth high ΔZ transducer.
Figure 8
Impedance plot for a wide bandwidth low ΔZ transducer.
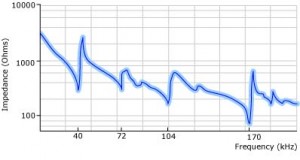
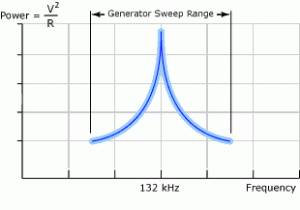
The last method this article will consider as a way to produce a designer waveform is by tailoring the impedance versus frequency curve of the transducer array. Figures 7 and 8 show examples of impedance versus frequency curves of two different transducer arrays (Note: the curves were chosen as the best known example of extreme ends of the impedance spectrum and are technically plots of the logarithm to the base ten of the magnitude of the impedance versus frequency on a linear scale). The figure 7 curve has a very sharp and deep resonance at 132 kHz. It is well known to transducer designers that the way to form this type of curve is by using four design features: First, designing the transducer so all horizontal surfaces are perpendicular to the axis of the transducer; second, designing the piezoelectric ceramic so one of its radial resonances matches the desired longitudinal harmonic resonance of the transducer; third, adjusting the harmonic resonant frequency of each of the bonded transducers in the array to be equal at the desired harmonic; and fourth, compressing the stack with the proper force to form the harmonic structure seen in the curves. The figure 8 curve has a much flatter impedance versus frequency characteristic (for example, the figure 8 curve is about 50 times flatter at 104 kHz than the figure 7 curve is at 132 kHz). This was accomplished by design features that are exactly opposite to the first three design features used to make sharp and deep resonance characteristics. The transducers in the figure 8 array have a cone shaped back mass that has no part of its back surface perpendicular to the axis of the transducer; they are designed so no radial resonance of the piezoelectric ceramics matches any of the desired longitudinal resonances of the transducer, i.e., 40 kHz, 72 kHz, 104 kHz or 170 kHz. Lastly, each bonded transducer in the array is at a slightly different resonant frequency so the resonance of the array is spread over a bandwidth. Each of the transducer arrays represented in figures 7 and 8 has unique characteristics and form different AM patterns within the tank that have advantages for different applications. First, consider the figure 7 transducer array. Its 132 kHz transducers were built with an aluminum front driver, an aluminum oxide insulator, a piezoelectric ceramic, an aluminum back mass, a compression bolt and appropriate electrodes. It differs from the most numerously produced Langevin type transducers in that it replaces one of the piezoelectric ceramics with an insulator and it uses aluminum rather than steel for the back mass. The first change saves money and the second results in a longer transducer. Although you would expect this metal stacked construction to be similar to every other Langevin transducer, when the four design principles described above are applied to this or any other transducer array, a sharp, narrow and deep impedance versus frequency curve results at the selected harmonic frequency. Now consider driving an array of these transducers with a generator that sweeps over a rather large range and that puts out a constant voltage at each frequency in this range. Since the power generated by the transducer at each frequency in the range is voltage squared divided by the real part of the impedance at that frequency, it is clear that this transducer array generates an extremely high peak power at the 132 kHz valley in the impedance curve and a significantly lower power at the frequencies in the range that are away from this valley. Figure 9 shows a plot of this type of output characteristic.
High power peak caused by sweeping a high ΔZ transducer characteristic.
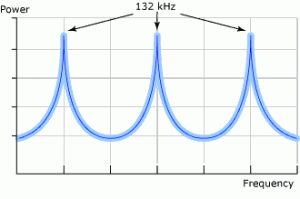
Repetitive power peaks resulting from a single sweep rate.
When combined with a constant sweep rate and a wide generator frequency sweep range, this figure 9 characteristic produces a unique amplitude modulation pattern in the tank (equally spaced, repetitive, high power spikes, the highest power point always at the same frequency). Figure 10 shows a plot of this characteristic versus time. It should be noted that the typical ultrasonic generator available today has an average output power of about 40 watts per transducer and, although the peak power in figures 9 and 10 is many times this 40 watt value, the very low power at the other frequencies in the range results in the average output power being typical of other modern systems. It is well known in the ultrasonic cleaning industry that if you want to cavitate liquids that are difficult to cavitate (e.g., semiaquous solvents), it is best to use a sweep rate (FM) that is at the upper response limit of the transducers and a very high peak power to average power ratio for the AM. This very high peak power to average power ratio is what you get with transducer arrays of the figure 7 type when driven by a constant voltage generator. The trade-off for being able to more easily cavitate in difficult to cavitate situations is potential damage to precision parts by one or more of four mechanisms. One, the evenly spaced high power spikes can excite the precision part into resonance and cause fractures. Two, the shock wave from the high power spikes can cause mechanical damage to microstructures. Three, the surface cavitation zone extends further from the radiating surface into the liquid at higher peak powers, since the energy in each cavitation implosion is higher in surface cavitation than in the bulk liquid, cavitation pitting or craters can occur on regions of the precision parts that are reached by this extended surface cavitation zone. Four, although the system is sweeping frequency, most of the power is at essentially one frequency or a very narrow range of frequencies that simulate a single frequency. This can exhibit the problems of the prior generation of single frequency ultrasonic systems. There is a fifth trade-off for designs of the type shown in figure 7; it has to do with performance. It is well known that each different range of frequencies has a unique cleaning effect and the only practical way to deliver many different frequency ranges and permutations of these ranges to a part is to drive the transducer array at each different frequency range with a multiple frequency generator. The transducer array of figure 7 has such extremely different impedance characteristics between frequency ranges (for example, the resonance at 66 kHz has approximately a 450 ohm to 2,500 ohm spread from resonance to anti resonance while the resonance at 132 kHz has approximately a 50 ohm to 10,000 ohm spread) that it is impractical to build a multiple frequency generator to drive these diverse characteristics. Therefore, the performance advantage of multiple frequency ranges is sacrificed for the easier cavitation caused by the high power spikes. The figure 8 curve is an optimized universal transducer for a multiple frequency system. The transducers forming this array consist of an aluminum front driver, two back-to-back piezoelectric ceramics, a steel back mass, a compression bolt and appropriate electrodes. It differs from the most numerously produced Langevin type transducers in that it has a cone shaped back mass and the metric compression bolt threads into the steel back mass rather than into the aluminum front driver. The first change helps flatten the impedance curve and the second maintains compression because the steel threads deform elastically during operation rather than the plastic deformation that occurs in aluminum threads. The relatively flat impedance versus frequency curve combined with a properly designed generator characteristic puts about the same power into the liquid at every different center frequency (i.e., 40 kHz, 72 kHz, 104 kHz and 170 kHz), and keeps this power relatively constant at the infinite number of frequencies contained in the four kilohertz bandwidths around each of the center frequencies. Therefore, the amplitude modulation (AM) pattern resulting from this type of transducer array is rectangular in nature (i.e., each frequency along the frequency spectrum is delivered with nearly equal power). The advantages and disadvantages of the rectangular AM pattern of the figure 8 system are the opposite of those for the power impulse system of figure 7. The elimination of damage caused by power spikes increases part yield and the benefits of the cleaning effects in the multiple frequency ranges improves part cleanliness.
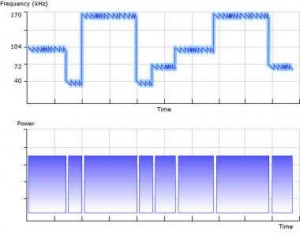
The top image shows a multiple frequency system changing from 104 kHz to 40 kHz to 170 kHz to 40 kHz to 72 kHz to 104 kHz to 170 kHz with a non-constant sweep rate monotonically sweeping over a 4 kHz frequency range. Notice the shorter exposure times at lower frequencies to prevent cavitation damage.
The bottom image shows a constant power at every frequency with a degas time inserted between transitions from one frequency range to the next frequency range.
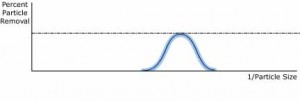
The improved part cleanliness is best demonstrated by graphs of percent particle removal versus particle size. It has been well established that higher frequencies remove a higher percentage of smaller particles. If this curve is assumed Gaussian in nature, then the graph shown in figure 12 results for a selected center frequency.
Particle removal for a selected center frequency.
The dotted line in figure 12 represents 100% and the reciprocal of particle size was used on the x-axis to spread out the small particle size numbers. Consider using the same selected center frequency as was used to generate the figure 12 graph but increase the exposure time to the ultrasonics. The result is figure 13.
Particle removal with increased exposure time to the selected center frequency.
Figure 13 shows that a higher percentage of all particles are removed with longer exposure time with 100% removal at particle sizes within the optimum range for the selected frequency. However, the efficiency of particle removal for particle sizes distant from the optimum size is poor. Consider the effect on the curve in figure 13 if a higher center frequency is selected. The curve in figure 14 results. The optimum size particle removal is a set of smaller size particles at this higher ultrasonic frequency.
Particle removal at a higher center frequency.
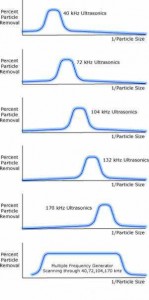
Figure 15 shows the percent particle removal versus the reciprocal of particle size for five different center frequencies. The exposure time at each frequency is chosen to give 100% removal for a range of particle sizes around the optimum value for that frequency. The sixth graph in figure 15 is the sum of the 40 kHz, 72 kHz 104 kHz and 170 kHz graphs. It shows that a wide range of particle sizes can be efficiently removed by scanning through multiple frequencies.
The first five graphs show particle removal for various ultrasonic frequencies. The sixth graph shows the wide range of particle removal that results from the use of multiple frequencies.
In summary, for precision parts cleaning, designer waveforms can be classified into two categories: (1) those that improve performance of the ultrasonic system and (2) those that reduce damage caused by ultrasonic waves and cavitation. In the first category, performance enhancement, are monotonic sweeping from high frequency to low frequency to purge contamination from the system, multiple frequency systems to obtain the cleaning benefits inherent at each different frequency, and higher ultrasonic frequencies to increase the cavitation density for higher percent removal rates. In the second category, damage reduction, are non-constant sweep rates to prevent exciting a delicate part into resonance, relatively flat transducer impedance characteristics to eliminate peak power shocks to delicate parts, and higher ultrasonic frequencies combined with short exposure times to lower frequencies to eliminate craters on the part surface. Figure 11 illustrates these characteristics. For rugged parts in difficult to cavitate liquids where damage is not a concern, a high power impulse type of amplitude modulation should be considered. Figure 10 illustrates this characteristic.


 English
 Spanish
 Chinese
 Canada
 Mexico
 United Kingdom


